
All of a biotech's financial steering, in one place.
Built so executives stay in control without spending their days on it. From the first assumption to board reporting, Redmontis replaces the patchwork of spreadsheets with a single, traceable source of data shared with your CFO.
Native FP&A modeling
A model structure built for R&D's long cycles and discontinuous spending: milestones, trials, disbursements, regulatory checkpoints.
Real-time burn & runway
Your cash trajectory and end-of-runway date recalculate the moment an assumption changes. No more frozen version while you wait for an export.
Built-in clinical milestones
Tie each milestone to its financial impact. A phase delay instantly translates into months of runway gained or lost.
Side-by-side scenarios
R&D spending is entered in a Gantt view with linked tasks: shifting one milestone automatically reshuffles the dependent tasks, with no manual rework. So you compare several trajectories side by side and decide in the meeting, not after.
Investor reporting
Generate clear, consistent reporting from the same data. A stable format from one board and one fundraise to the next.
Assumptions & traceability
A single source for key drivers, with version history to defend every figure before a board or an auditor.
From raw data to a defensible decision.
- Enter or import your key assumptions once
- See burn, runway and milestones on a single view
- Test scenarios without breaking the model
- Export board-ready reporting
Five steps, from input to decision.
You enter your data once. Everything else updates, reads and simulates.
Parameters & assumptions
You enter your key parameters and assumptions.
Spending & funding
You enter personnel costs, operating expenses in a Gantt view, fundraises and grants.
Cash & runway
You instantly read your cash position and runway.
Funding need
You assess the funding need over the period, via the Use of Proceeds.
Scenario simulation
You simulate scenarios, with automatic shifting of all linked tasks (Gantt view).
The product, screen by screen.
The solution covers nine screens that all read from the same base: change one assumption and everything updates. Here are the main ones, as an executive or their CFO uses them every day.
Data from a fictional case, for demonstration purposes only
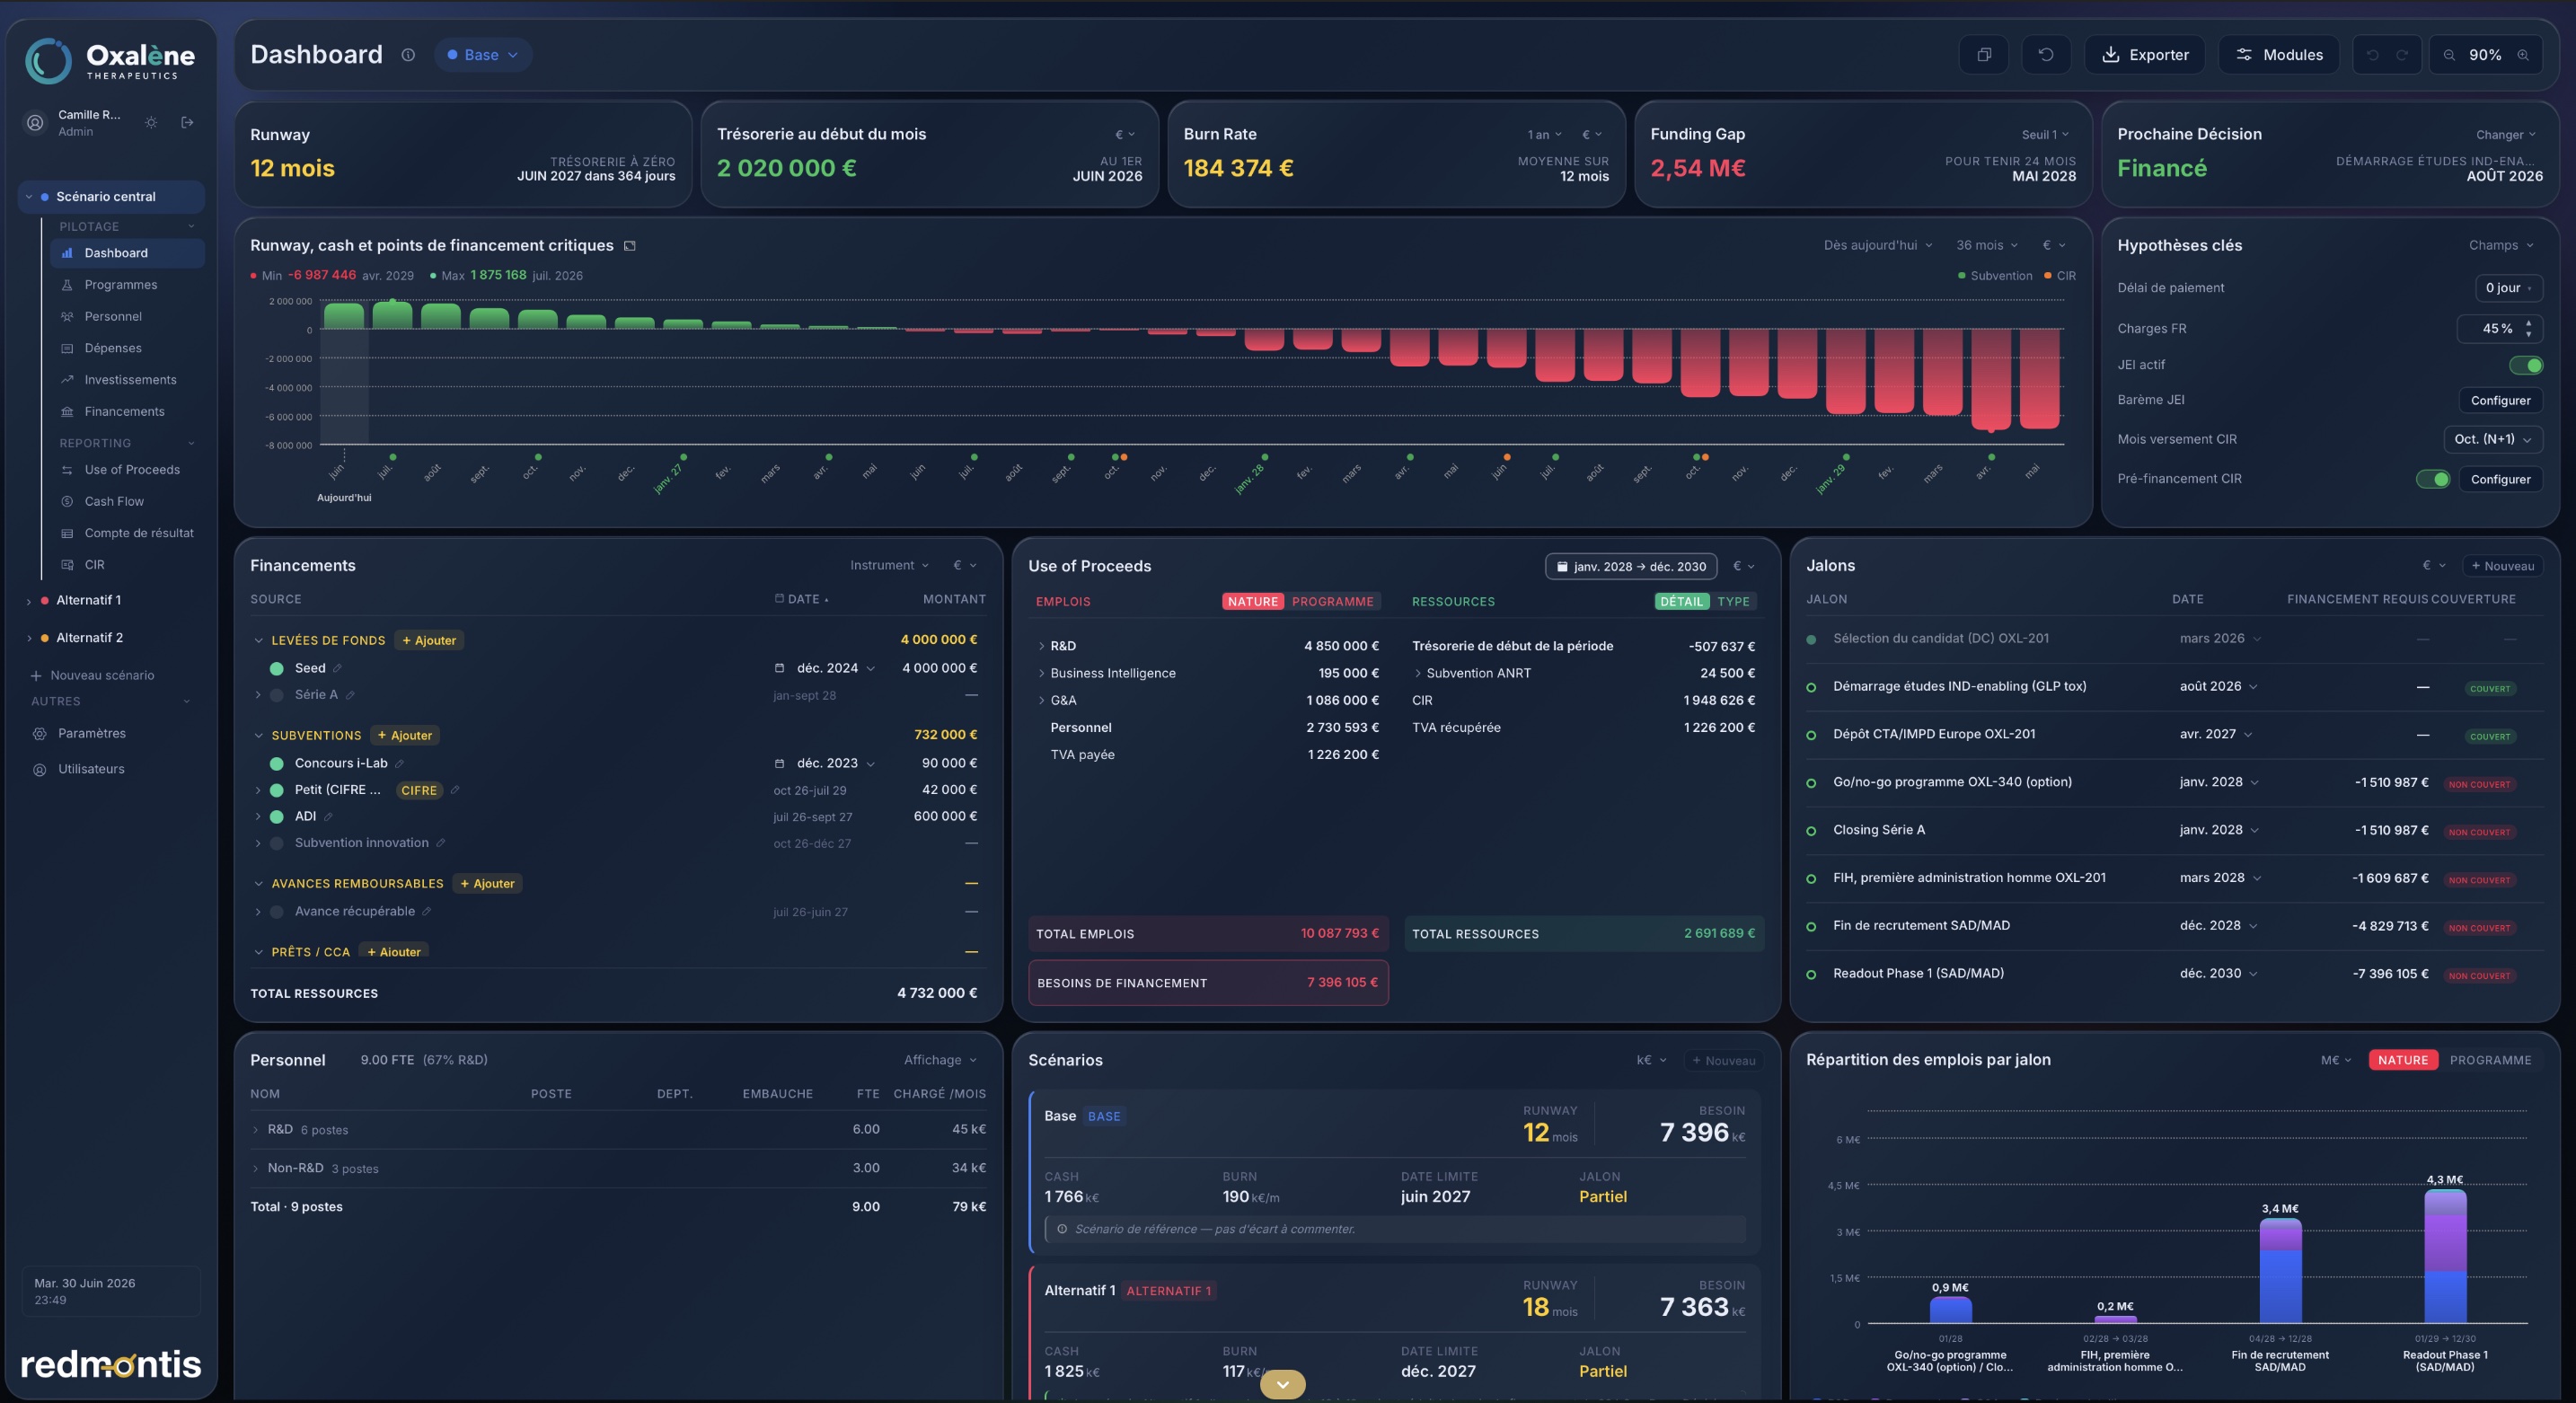
Dashboard
Runway, burn rate, cash position, funding gap and next decision brought together on a single screen. The big picture the CEO and CFO look at first.
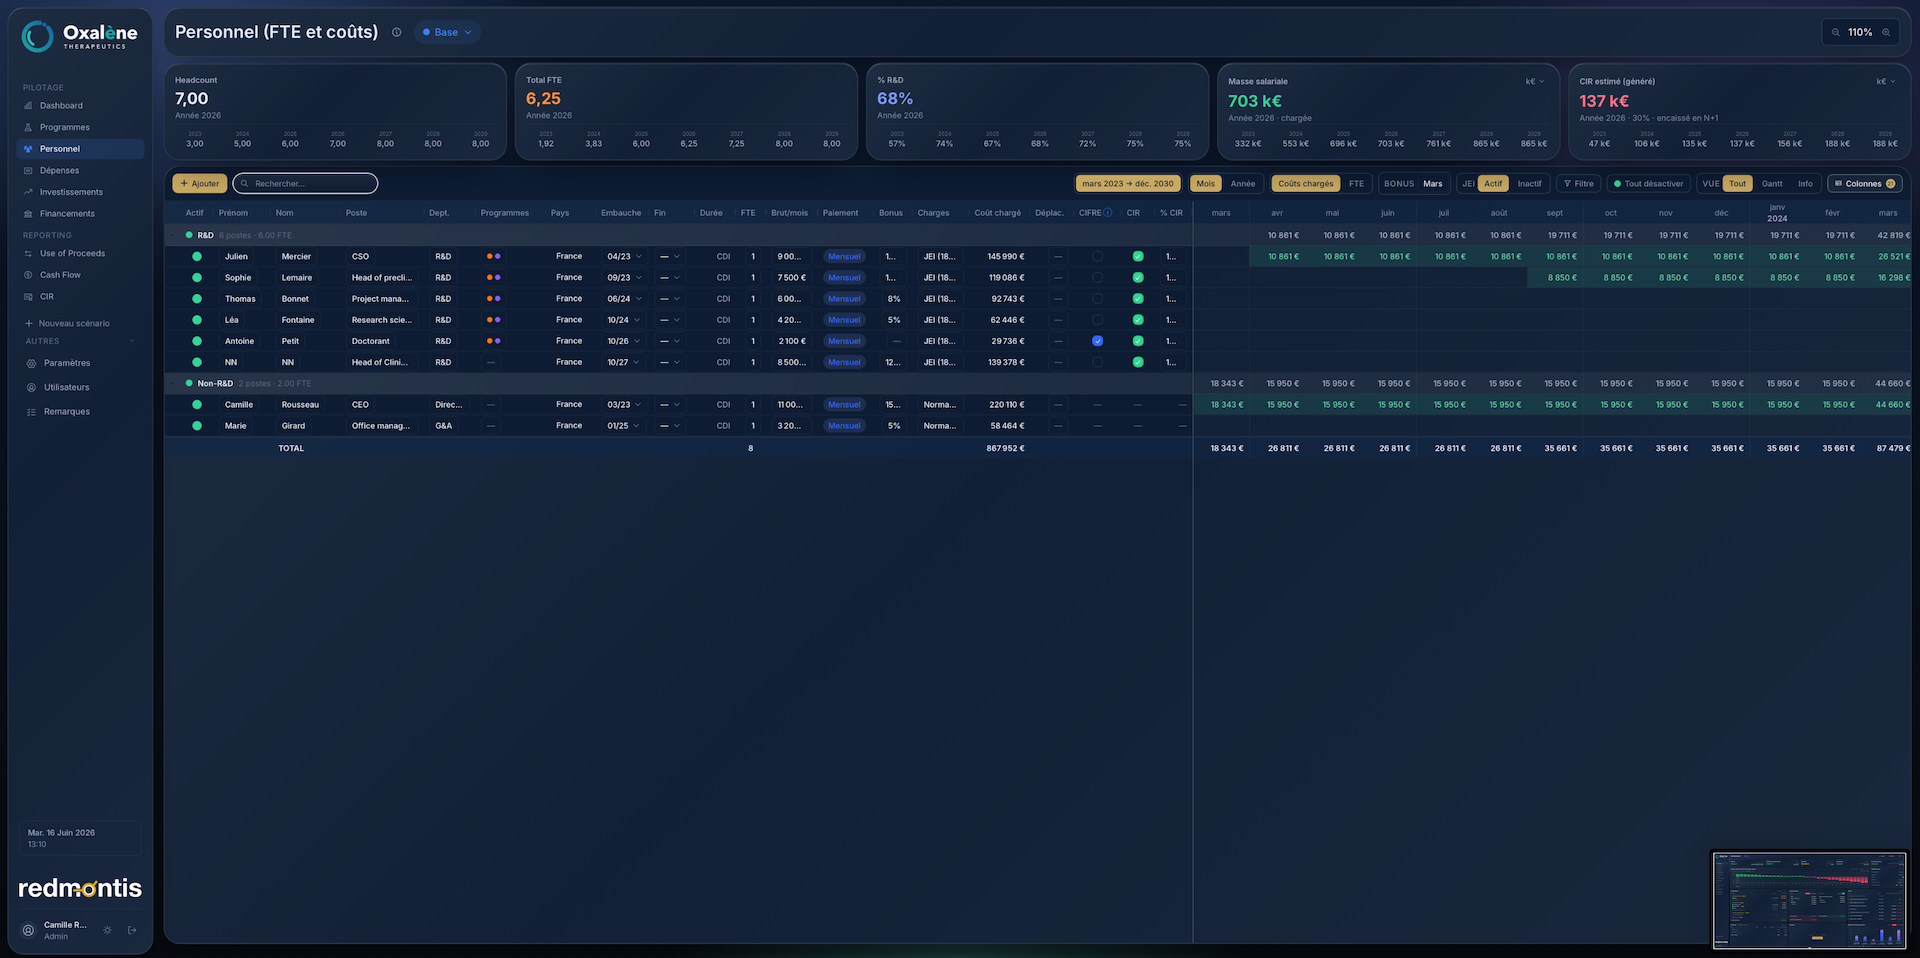
Personnel
FTE, payroll, R&D share and R&D personnel ratio, role by role and month by month. The US version will include the inputs required for Section 41 IRC qualification.
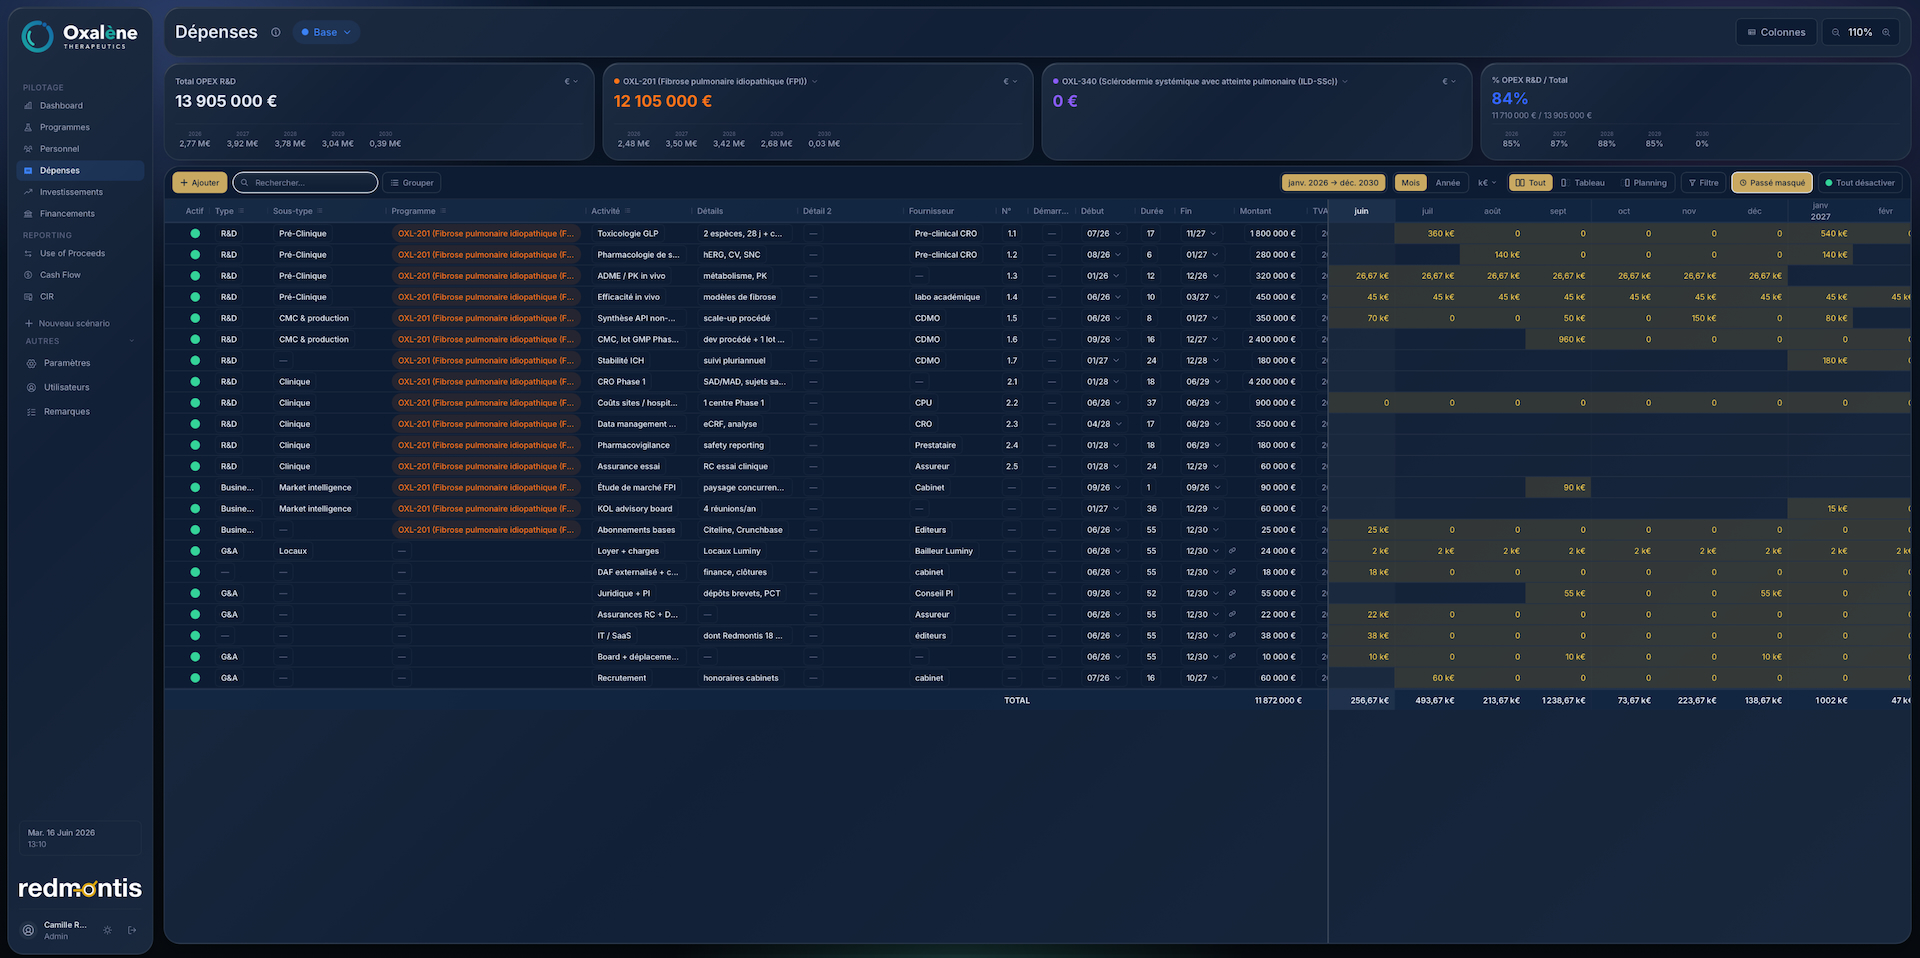
Spending
R&D OPEX detailed by program (pre-clinical, CMC, clinical, business, G&A), entered in a Gantt view with linked tasks, according to your development plan.
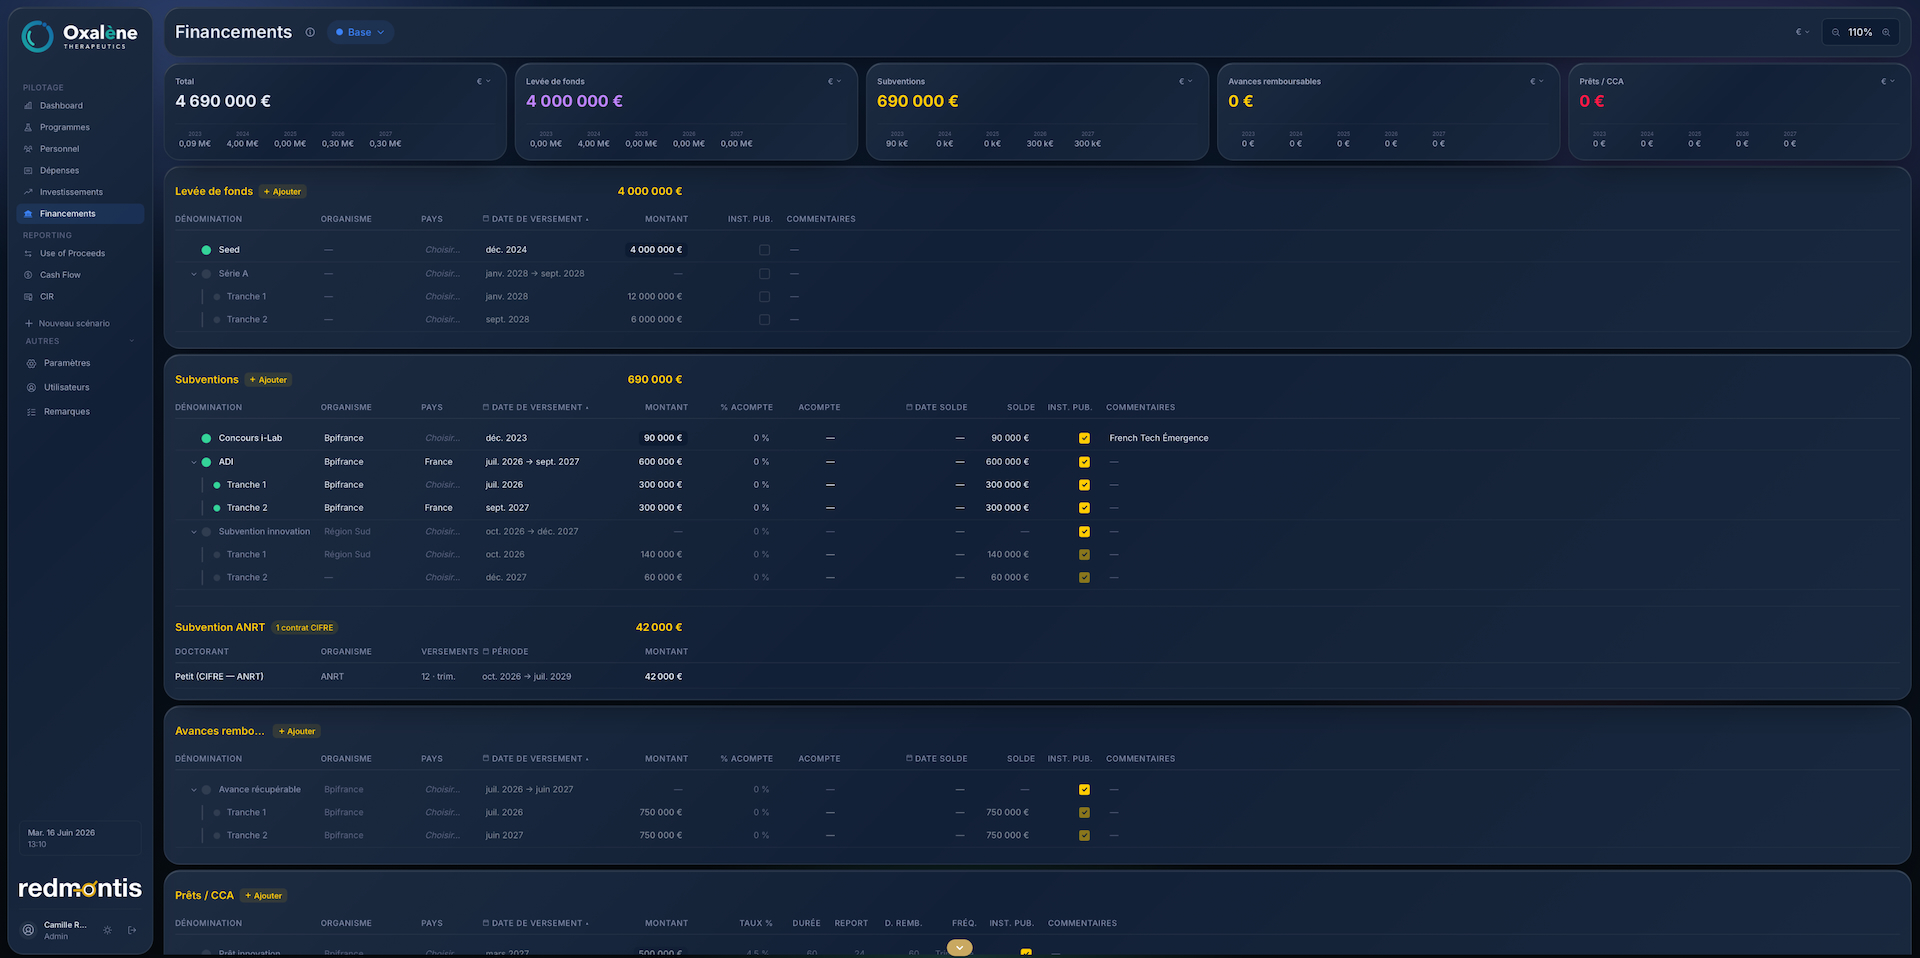
Funding
Equity rounds, SBIR/STTR grants, NIH funding and non-dilutive sources, tracked at payment and tranche level.
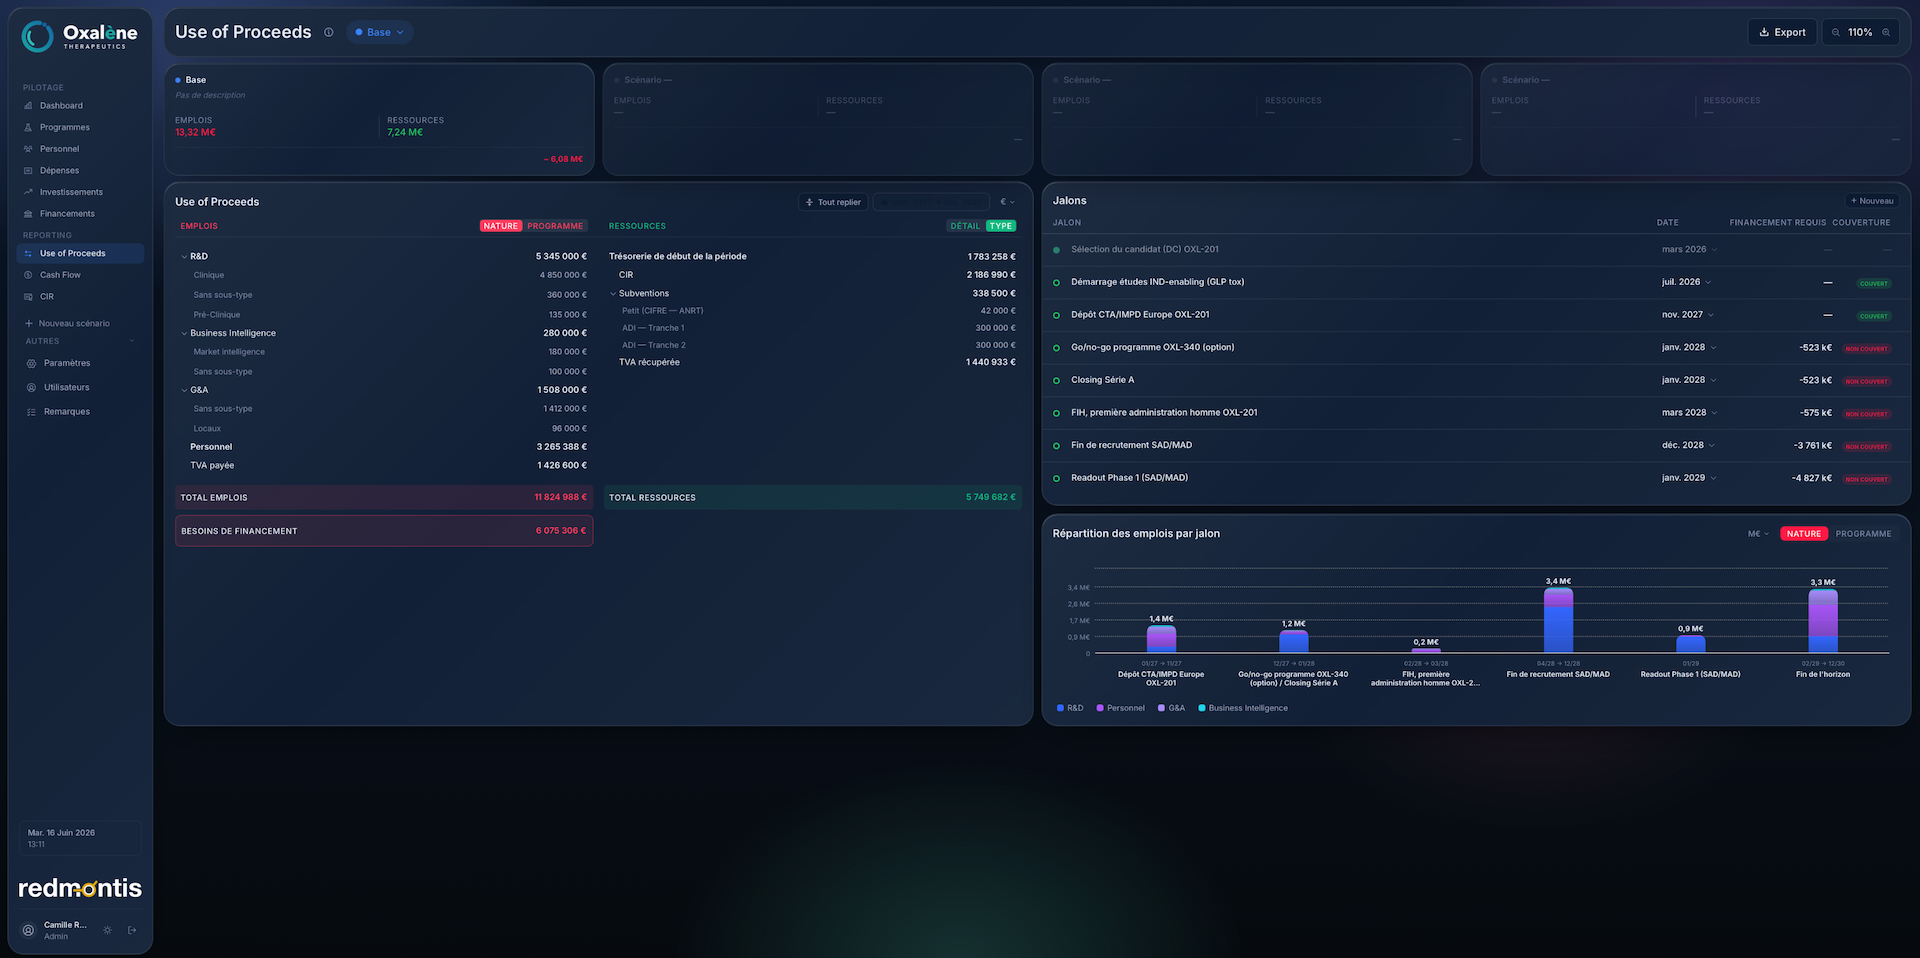
Use of Proceeds
Uses / Sources table linked to milestones, with funding needs and coverage. Board-ready.
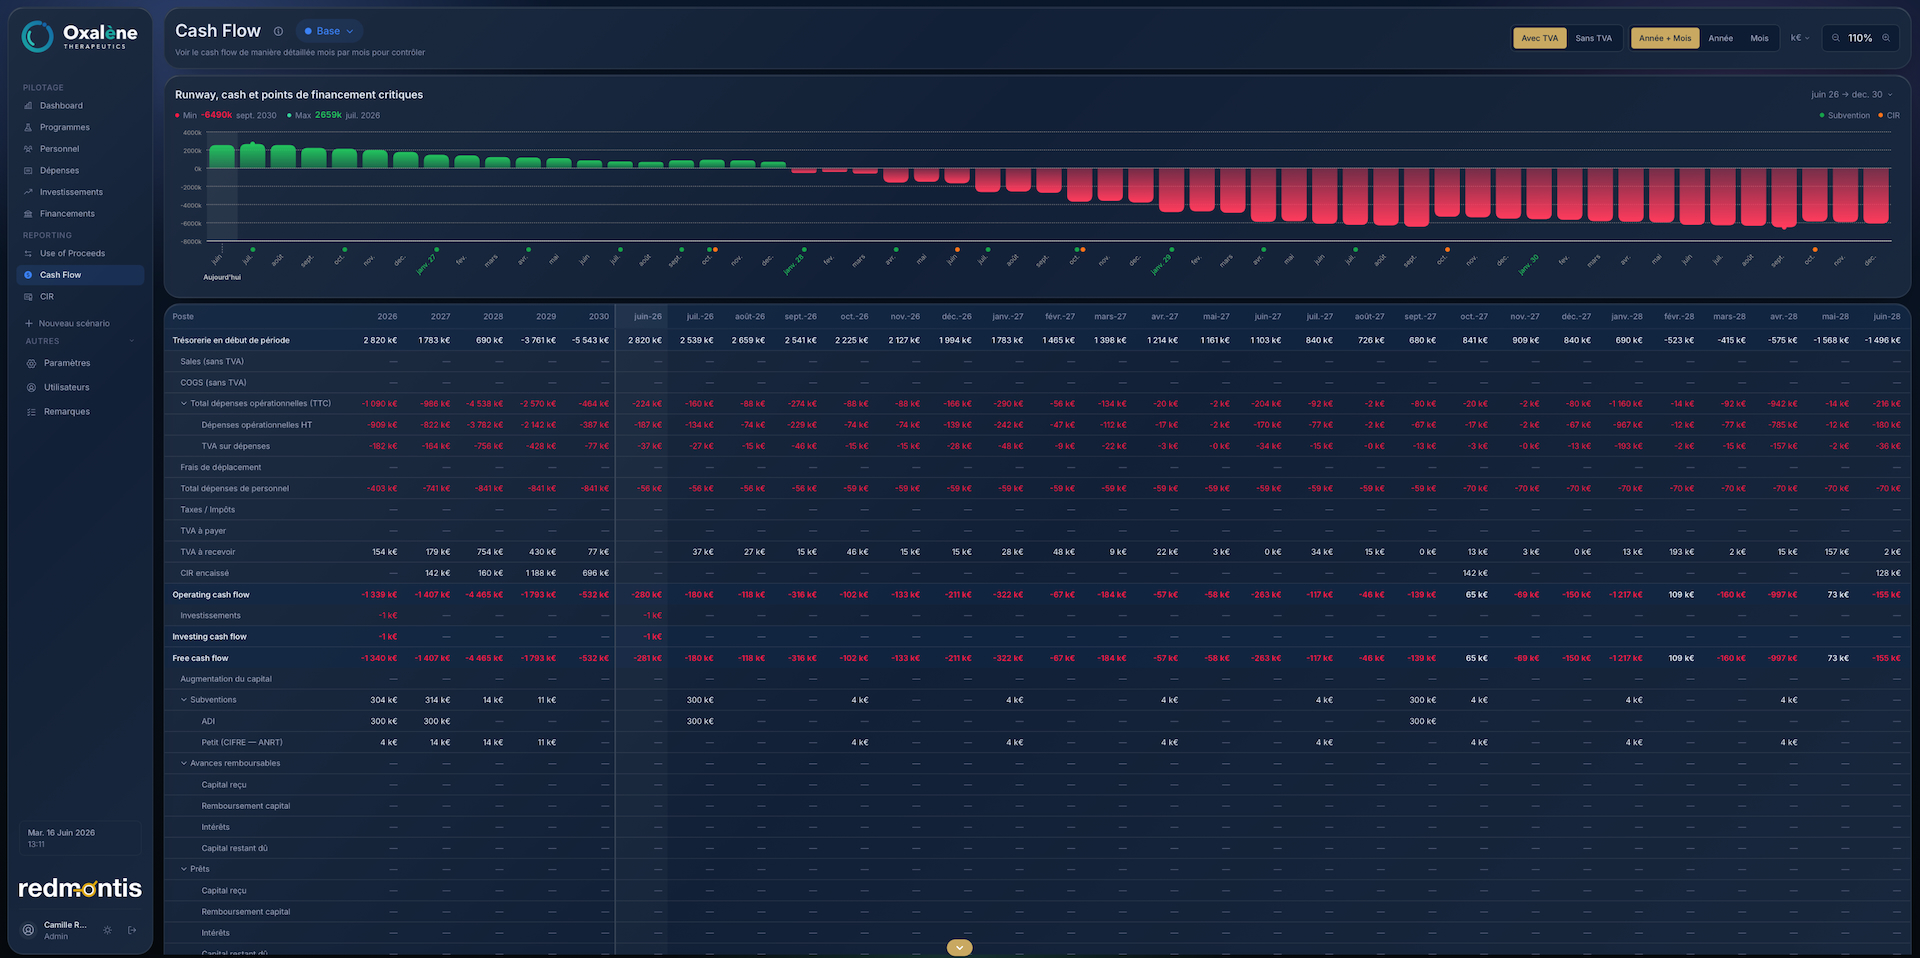
Cash Flow
Cash position month by month, from operating cash flow to free cash flow through to the end-of-period balance.
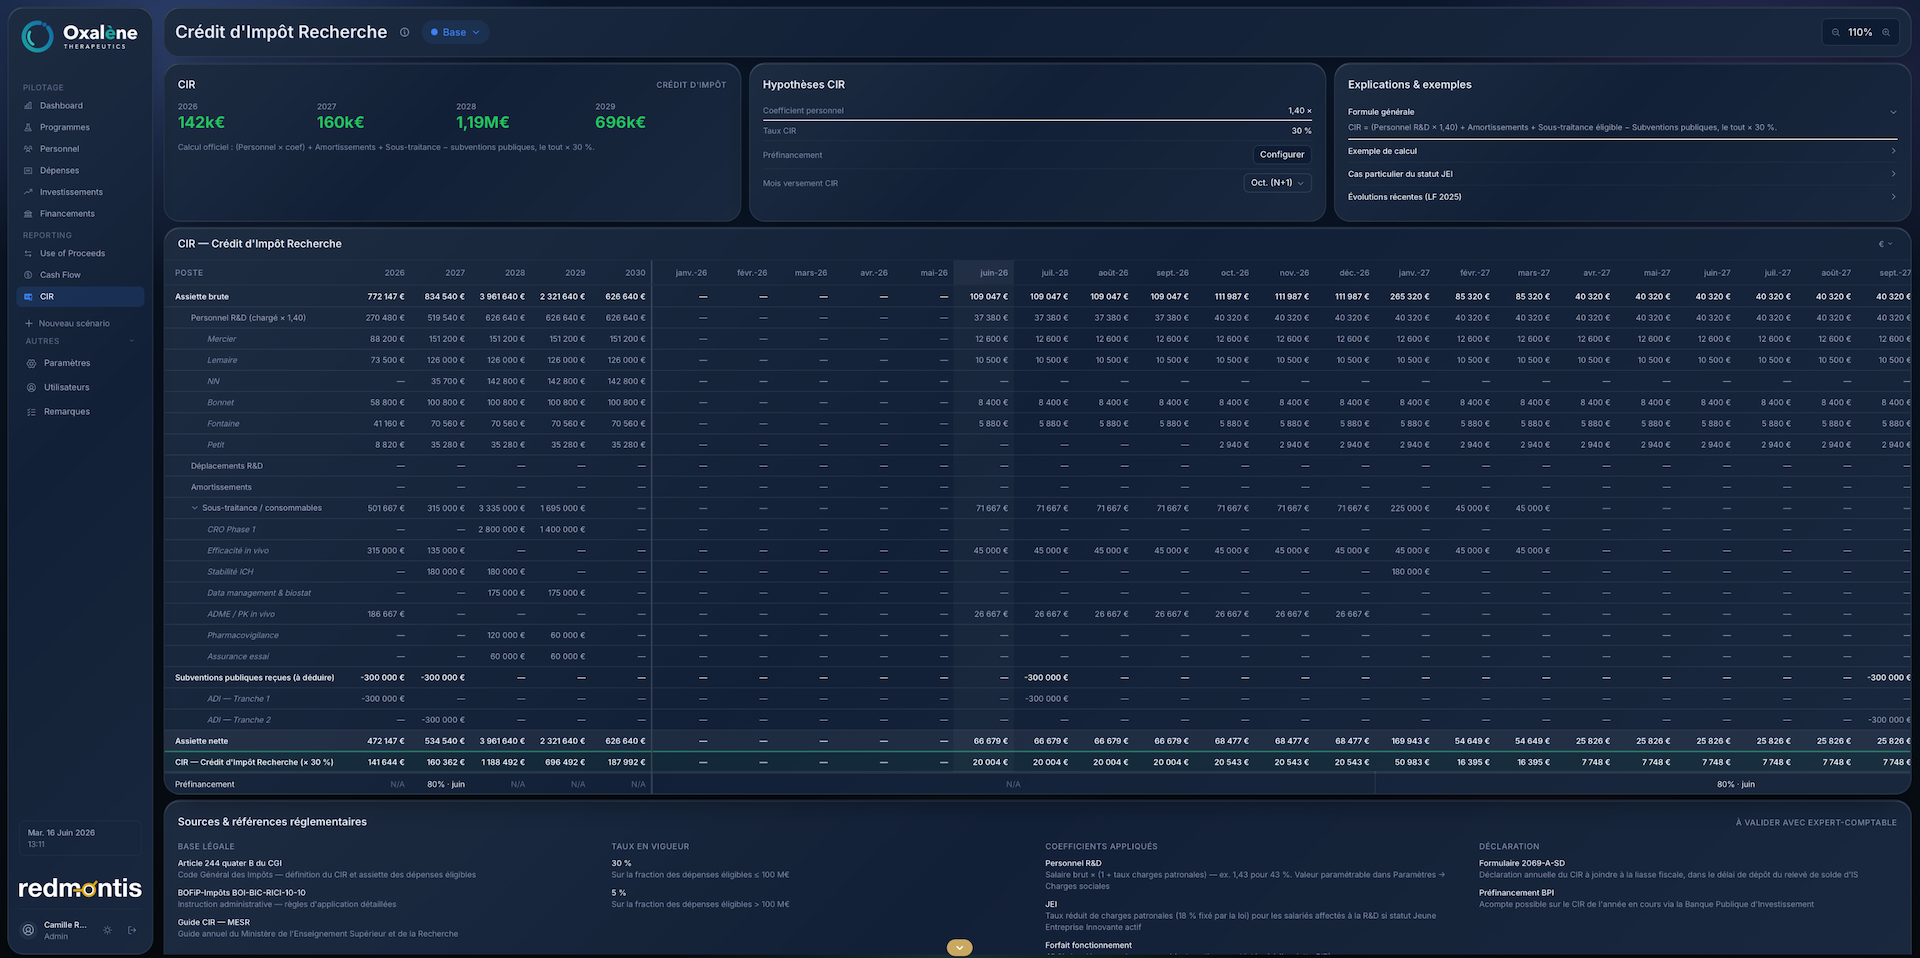
R&D tax credit
The current screen calculates the R&D tax credit. The US version will be adapted to the Section 41 IRC process: qualified research expenses, base amount and credit rate as applicable under US federal law. Ready for your CPA.
A precise finance tool, not a generalist.
Redmontis is neither an accounting ERP, nor a clinical data tool, nor software for lab technicians. It's an instrument for finance people working in a demanding scientific context.
Your financial data, treated as such.
Runway, fundraise scenarios, funding amounts: a biotech's most sensitive data. A system that meets the highest security standards.
Encryption
Data encrypted at rest (AES-256) and in transit (TLS 1.3).
Infrastructure
Application processing and delivery run by Vercel in the Paris region. Database and authentication operated by Supabase on Amazon Web Services in the eu-west-3 region, Paris. All data at rest resides in the European Union. No transfer outside the European Union in normal operation.
Per-client isolation
Multi-tenant partitioning (Row-Level Security): each customer sees only their own data.
Audit & control
Logging of exports and shares, right to export and to delete.
A demo on your numbers beats a product sheet.
We start from your clinical stage, your cost structure and your fundraising timeline.
Request a demo